Project Overview
Managing cloud costs efficiently is critical for businesses leveraging AWS. This project involved building an interactive Tableau dashboard to analyze AWS usage, track cost trends, and identify opportunities for cost optimization. The goal was to help organizations gain visibility into their cloud spending, reduce wasted resources, and improve financial operations (FinOps) strategies.

Interact live with this dashboard on Tableau Public
Key Objectives
- Provide a comprehensive breakdown of AWS cloud costs
- Identify cost-saving opportunities through Reserved Instances, Savings Plans, and Spot Instances
- Highlight underutilized resources and waste to reduce unnecessary spending
- Track monthly cost trends and usage patterns for better forecasting
Features and Insights
1. Total AWS Cost & Savings Overview
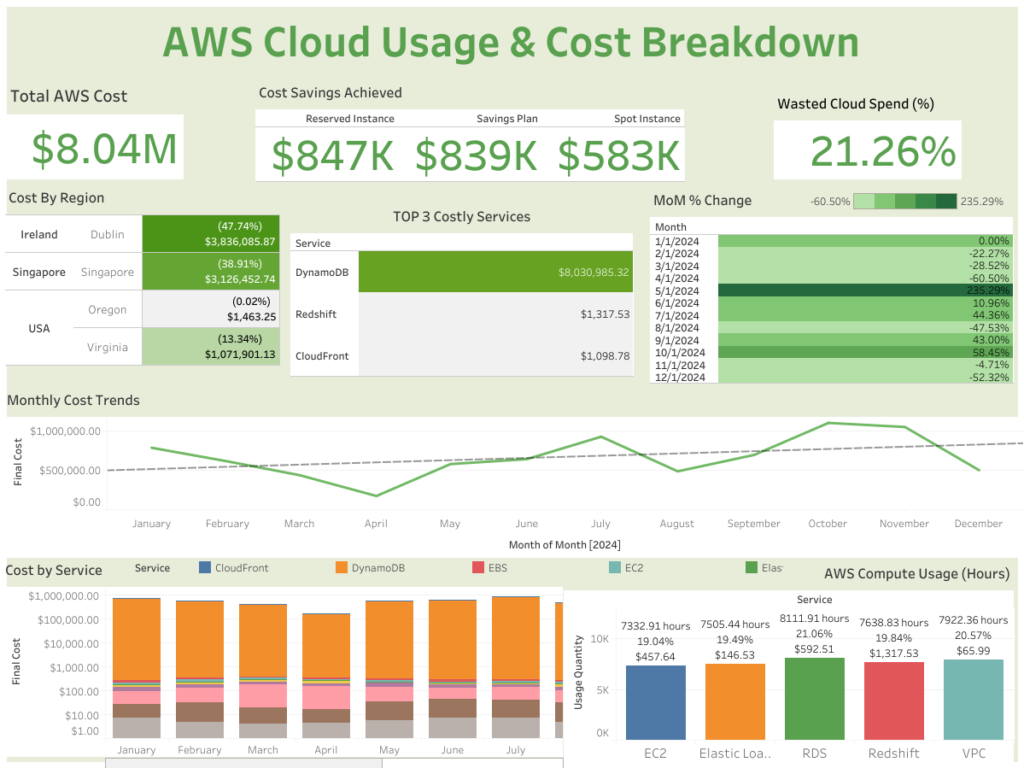
- Displays total AWS spend ($8.04M) along with savings from Reserved Instances ($847K), Savings Plans ($839K), and Spot Instances ($583K).
- Helps teams understand how much they are saving and where additional optimizations can be made.
2. Wasted Cloud Spend (%)
- Highlights 21.26% of total AWS costs as potential savings due to underutilized or idle resources.
- Enables data-driven decisions to right-size infrastructure and deallocate unnecessary services.
3. Cost by Region
- Breaks down AWS costs by geographical region, showing that Ireland accounts for 47.74% of total spending.
- Helps teams assess whether workloads should be shifted to more cost-effective regions.
4. Top 3 Costly Services
- Identifies DynamoDB as the highest-cost service ($8M), with Redshift and CloudFront also contributing significantly.
- Provides visibility into which AWS services drive the most cost and where optimizations can be made.
5. Monthly Cost Trends and MoM % Change
- Shows fluctuations in AWS spending over time, with a 235% increase in May and cost reductions in later months.
- Helps teams forecast future expenses and plan budgets accordingly.
6. Cost by Service & Compute Usage Analysis
- Tracks AWS service usage, including EC2, EBS, RDS, and others.
- Displays compute hours and cost contribution per service, ensuring better allocation of cloud resources.
Tools and Technologies Used
- Tableau for data visualization and dashboard creation
- AWS Billing Data for cost tracking and analysis
- Financial Operations (FinOps) best practices for cloud cost optimization
Impact and Value
- Helps organizations reduce cloud waste and optimize spending
- Enables teams to make data-driven decisions for cost efficiency
- Provides a clear visualization of AWS financial operations


