The Problem
One morning, a developer opened their AWS dashboard and saw their Lambda costs had tripled overnight.
No alerts. No warning. Just a bigger bill and a scramble to figure out what went wrong.
This isn’t rare.
For many cloud teams — especially small to mid-sized ones — daily cost tracking is manual, reactive, or non-existent. And most cost anomalies aren’t caught until the end of the month… after the damage is done.
The “Aha!” Moment
I thought:
“What if your AWS bill could talk to you in real time?”
So I built a bot that watches your AWS cost data like a hawk — and pings you on Slack the moment something unusual happens.
Not days later. Not at the end of the month. Right when it happens.
The Solution – What I Built
Tech Stack:
Python, Pandas, Matplotlib, Jupyter Notebook, Slack API, AWS CUR, GitHub
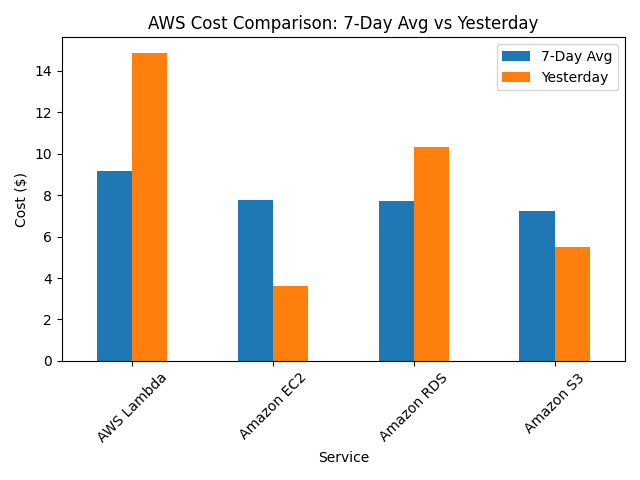
This lightweight, real-time bot compares yesterday’s AWS cost to the rolling 7-day average and flags anything that looks like a spike. When it sees a jump, it sends:
📊 A chart showing the comparison

📣 A Slack message like:

It’s like a financial pulse check — delivered straight to your team.
Key Features
Real-Time Spike Detection – Compares daily AWS service costs to your weekly average and flags anything unusual
Slack Alerts – Immediate notifications with the exact service that spiked and by how much
Visual Reporting – Optional graphs sent alongside alerts
Secure Setup – Uses .env for API token security
Deploy-Ready Template – GitHub repo includes config and setup for solo devs and teams
Why It Matters
Without a tool like this, teams are flying blind between billing cycles. This bot creates:
✅ Immediate visibility into cost anomalies
✅ Faster mitigation when something breaks or scales unexpectedly
✅ Peace of mind — knowing the bill won’t surprise you
It’s not trying to replace FinOps dashboards — it’s built for speed and simplicity.


