1. Objective
This project was designed to showcase what’s possible when you combine AWS cost transparency with actionable FinOps insights—no extra tools, no third-party platforms, just raw data and smart execution.
My goal was to create a centralized view of cloud spend using the AWS Cost and Usage Report (CUR) and Databricks SQL. The result is a functional, insight-driven dashboard that highlights:
- Monthly spend patterns and cloud run rate
- Gaps in tagging and cost attribution
- Department-level cost allocation
- RI utilization and idle spend
- Unit cost by usage type
- FinOps maturity levels across tagging, allocation, and optimization
Ultimately, this dashboard makes it easier to ask the right questions—and make the right decisions—around cloud cost governance and optimization.
2. Data & Tools
The data comes from three months of AWS CUR usage (Oct–Dec 2018), formatted in Parquet. I worked directly in Databricks SQL to process and visualize it.
This setup included:
- Writing SQL queries to aggregate usage and cost data
- Parsing usage types like
BoxUsage,DiscountedUsage, etc. - Pulling tag keys for department and environment-level allocation
- Designing all visualizations within the Databricks SQL dashboard layer
This workflow was intentionally lean—ideal for teams looking to maximize insight without a heavy stack.
3. Key Features
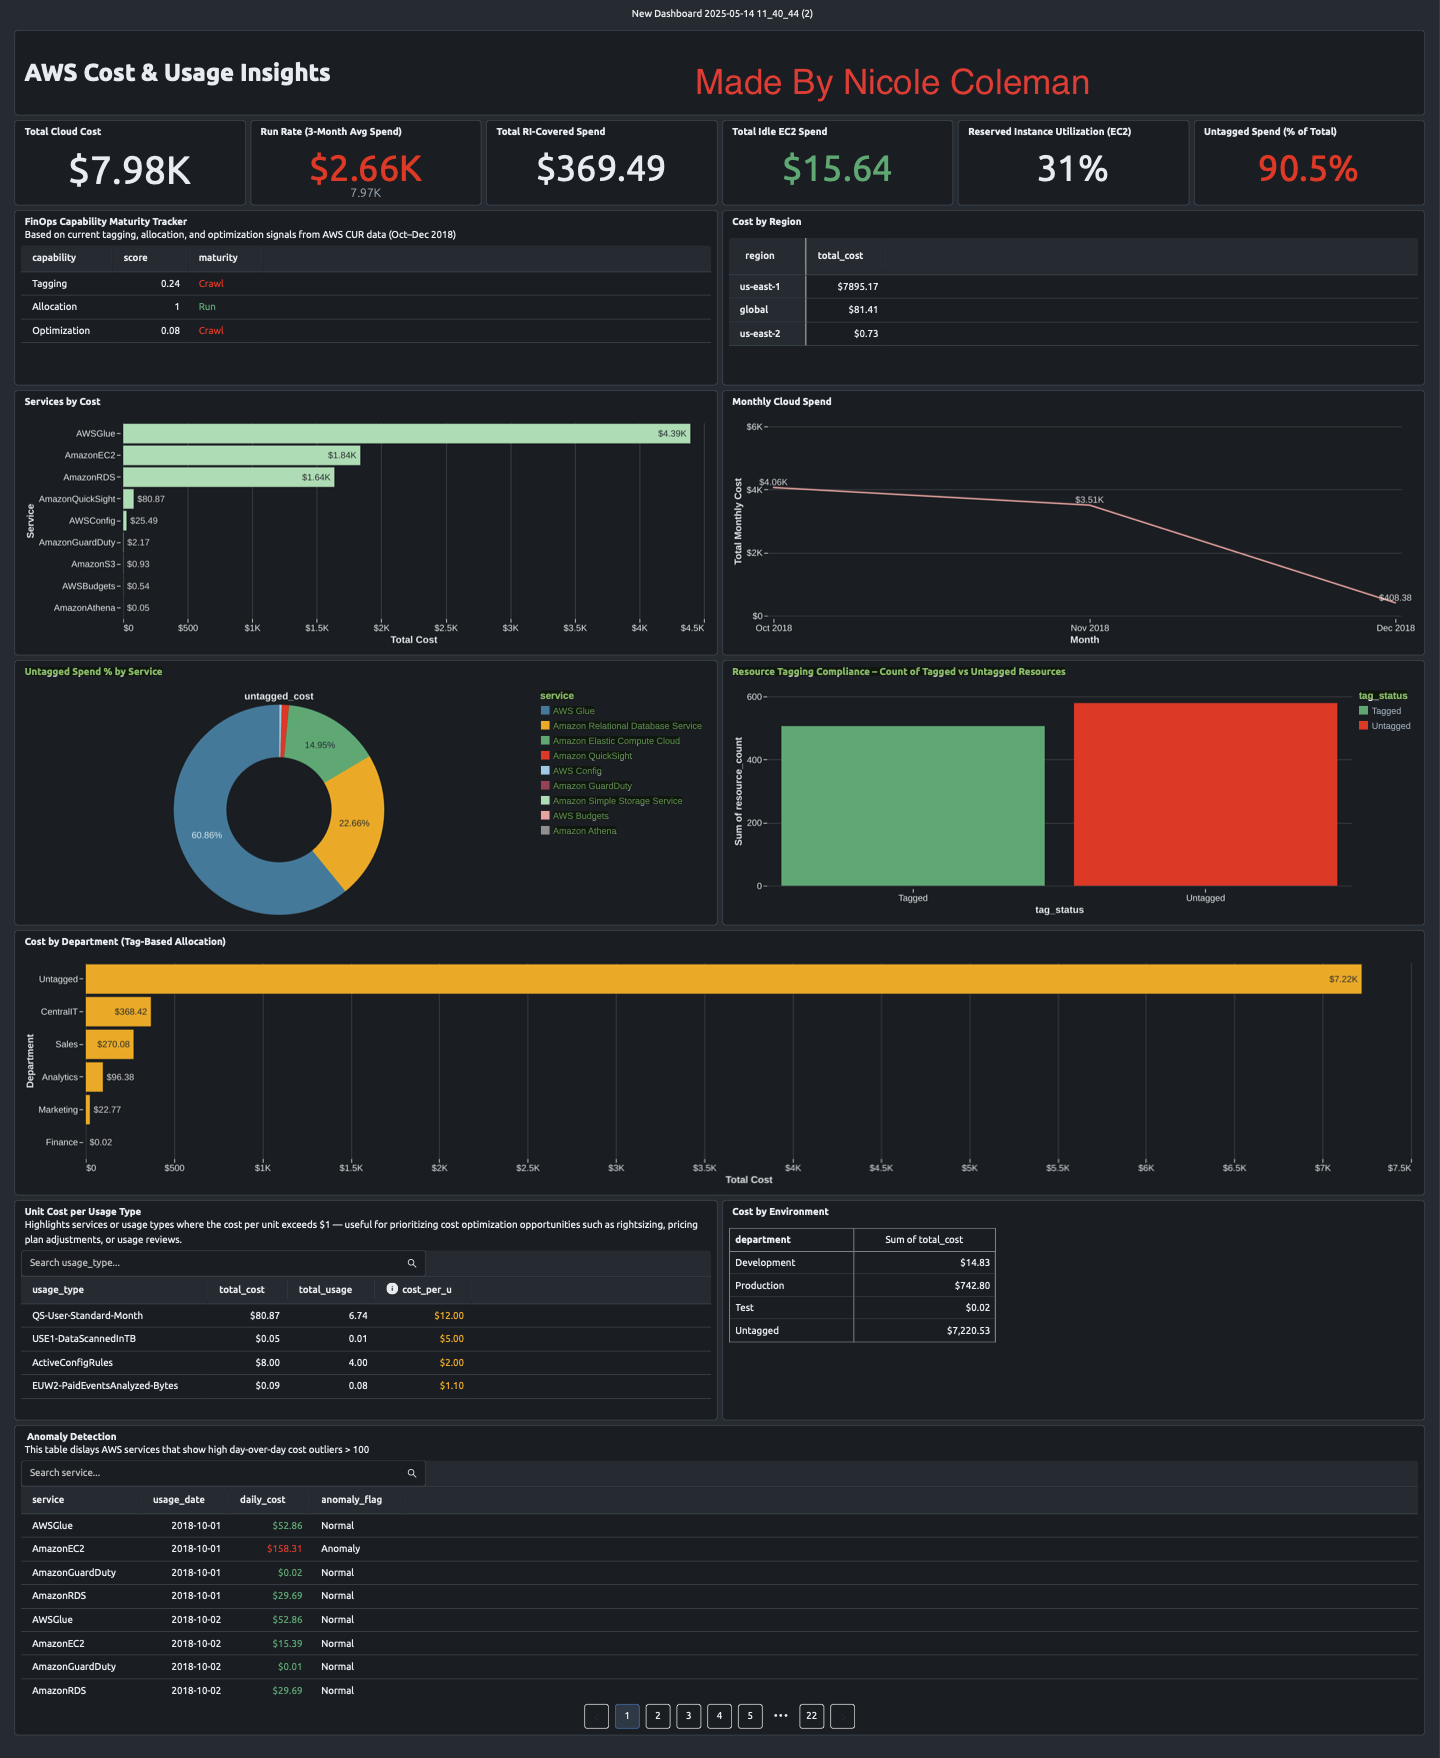
The dashboard covers a full range of FinOps fundamentals:
- Total AWS Cost Tile – High-level visibility into spend
- Monthly Spend Trend – Spot anomalies and track run rate
- Tag Compliance – See the ratio of tagged vs untagged resources
- Untagged Spend (Total + by Service) – Understand where attribution is missing
- Cost by Region – Identify high-cost areas or rebalance as needed
- Departmental Allocation – Link spend to internal ownership using tags
- RI Spend and Utilization – Show how much EC2 usage is covered
- Idle EC2 Spend – Highlight underused compute for right-sizing
- Unit Cost by Usage Type – Uncover unusually high cost-per-unit signals
- Anomaly Detection – Track daily fluctuations to catch outliers early
- FinOps Maturity Tracker – Score each area (Tagging, Allocation, Optimization) using Crawl/Walk/Run benchmarks
Each widget was built to support quick reviews and deeper dives, depending on who’s in the room.
4. Insights & Findings
The data revealed some clear takeaways:
- Overall spend was stable, with no major spikes across the 3-month window
- AWS Glue was the top cost driver—worth a closer look at job schedules and data volumes
- RI utilization was just 31%, signaling a missed opportunity for cost savings
- Over 90% of resources were untagged, limiting visibility and accountability
- Spend was concentrated in
us-east-1, which may reflect legacy defaults or missed opportunities for regional balancing
Without clear tagging, it’s difficult to align spend with teams or departments. Without strong RI coverage, there’s money left on the table.
5. Challenges & Decisions
Like any real-world project, there were trade-offs:
- Limited time window: Three months of historical data restrict trend forecasting
- No Savings Plans (2018 dataset): RI-only environment meant limited optimization levers
- Blended vs Unblended Cost: RI analysis required switching to blended cost for accuracy
- Compute Limits: To save Databricks credits, I built and tested queries in Notebooks before dashboard integration
- Manual Formatting: Databricks tiles required extra setup to handle dollar signs and percent values
Even with these constraints, the goal was met: deliver a clean, professional, and actionable cost view.
6. Maturity Assessment
Based on the findings, here’s how the environment scores on FinOps maturity:
| Area | Stage | Notes |
|---|---|---|
| Tagging | Crawl | Tag adoption is low; enforcement needed at deployment |
| Allocation | Walk | Some data exists, but gaps in attribution prevent full chargeback |
| Optimization | Crawl | Low RI utilization and idle spend suggest missed savings opportunities |
This dashboard provides visibility to start operationalizing FinOps—not just tracking costs, but acting on them.
7. Next Steps
To move from visibility to value, the following actions are recommended:
- Enforce Tagging at Launch – Standardize required tags (owner, env, dept)
- Establish Cost Ownership – Use tagging to support showback/chargeback
- Revisit Commitment Strategy – Assess RI vs on-demand vs SP coverage
- Introduce Forecasting – Layer in budget tracking and forward-looking KPIs
- Make KPIs Actionable – Use the maturity tracker to drive monthly review loops
Final Thoughts
This dashboard was built to solve a real challenge: how do you give stakeholders a clear, confident view of cloud spend, without relying on third-party tools or overcomplicating the process?
It’s flexible enough to scale. Focused enough to act on. And built to support both finance and engineering conversations.
Now that the foundation is in place, it can evolve into a fully automated, live FinOps operating model with alerts, forecasting, and decision-ready insights baked in.